In this article, I'll focus on getting as much value as possible from training data, particularly features. We'll continue our journey started in Linear Regression model using Elixir and Nx. Let's jump into the practice and learn how to squeeze lemons (features are sour!) to make a tasty lemonade!
What is Feature Engineering?
Getting as much high-quality data as possible is essential in Machine Learning. But the question is "What high-quality does mean?". In terms of features, it means that they should be interpretable by the ML model (numbers) and meaningful for the training process.
"Meaningful?" Yeah, in short, it means that meaningful features should be correlated with labels. Another thing is that features should match the ML model, since e.g. it seems that for linear regression parabolic-curve features are not too useful... Until you enhance your features!
Feature engineering is a process of transforming and creating features based on your current dataset. Feature scaling we did in the previous article is one of the most common and effective feature engineering techniques.
Let's analyze the dataset for MPG (Miles Per Gallon) predictions.
Analyze the dataset
| passedemissions | mpg | cylinders | displacement | horsepower | weight | acceleration | modelyear | carname |
| FALSE | 18 | 8 | 307 | 130 | 1.752 | 12 | 70 | chevrolet chevelle malibu |
| FALSE | 15 | 8 | 350 | 165 | 1.8465 | 11.5 | 70 | buick skylark 320 |
Here are two examples from the dataset. There's one label (mpg) and 8 possible features. Which features seem to be useful for Linear Regression? Hard to say... But it's much easier to say, which is irrelevant: carname.
There are two problems with carname: it's hard to convert to number and what's even more important: does carname affect MPG at all? Naming a car like "Super-Duper Eco X123" will make it more fuel efficient? For car dealers: definitely 😉 For data engineers: nope. We can skip it at all.
carname was an easy one. The other features are more tricky, so let's make the analysis easier and plot some graphs.
Feature graphs
Now I'll show you graphs for each feature (x) for MPG (y).
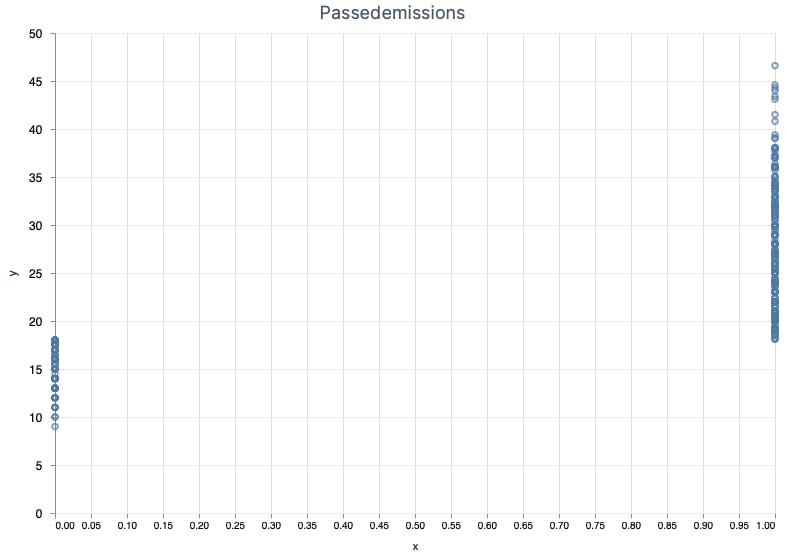
passedemissions are cumulated for x=0 and x=1. Originally, the values were FALSE and TRUE, so I mapped them to 0 and 1 respectively. Hmm... there's some correlation, since for x=0 MPG is lower than for x=1, but it doesn't seem to be useful for the linear regression model.
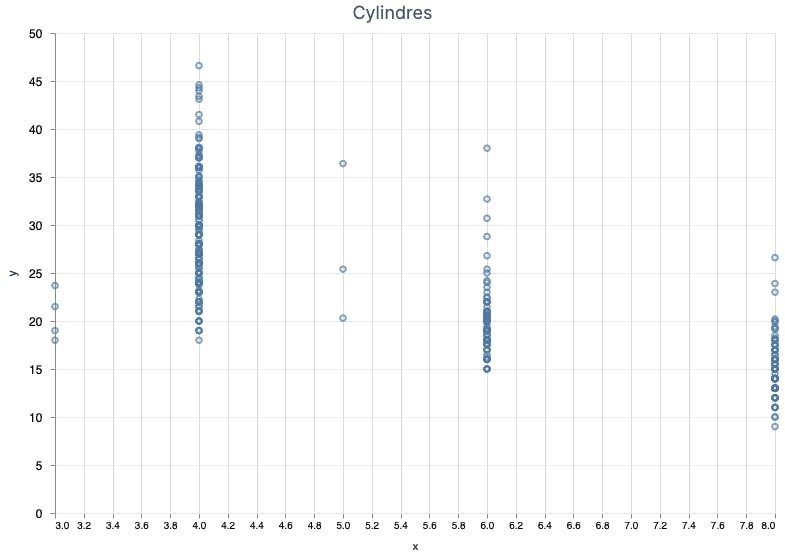
This is more meaningful since it looks like more cylinders = lower MPG. BTW, I haven't known about 5-cylinder cars before.
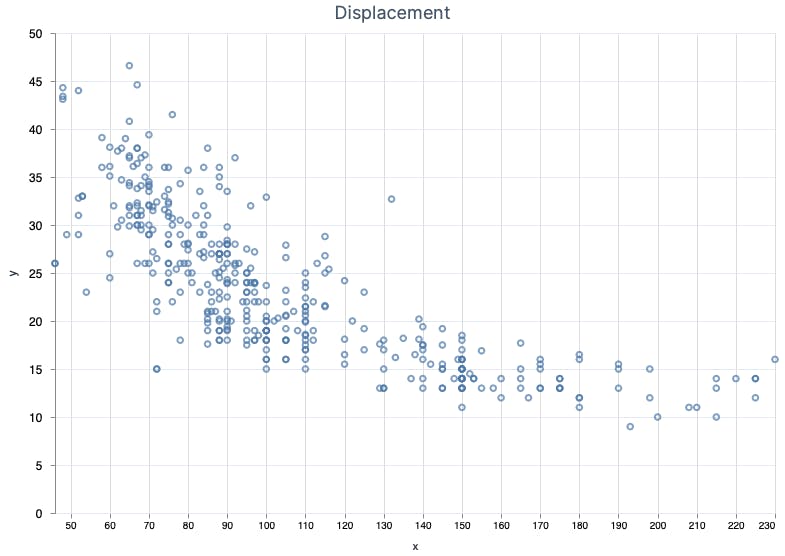
displacement was the primary feature I used in the previous article and as you can see there's a strong correlation.
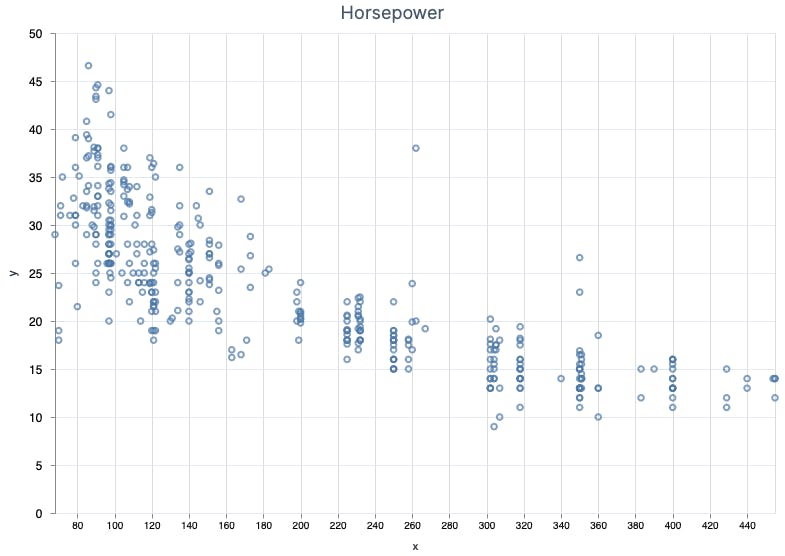
horsepower is pretty similar to displacement, which makes sense.
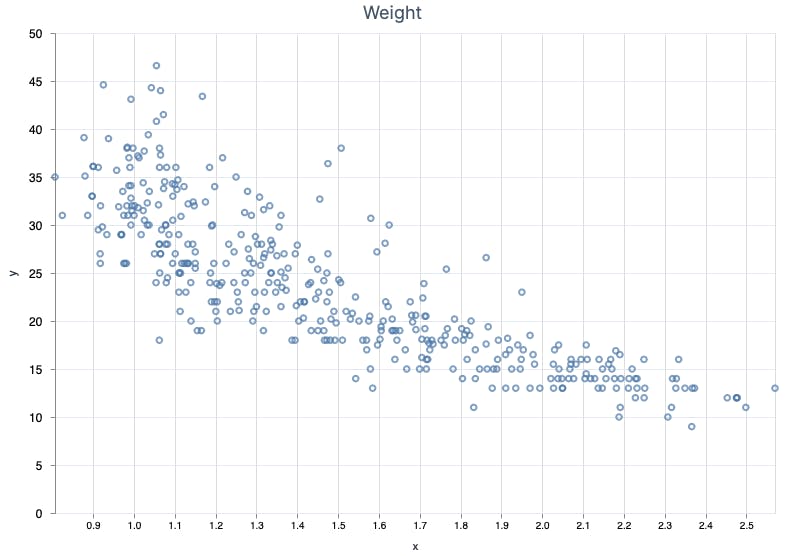
I was curious about weight and as I thought, it indeed affects MPG.

acceleration doesn't look promising, since MPG values are spread chaotically all over the graph.

Last but not least, modelyear. This one is interesting since it varies for a given year, but on the other hand, you can see a trend that newer cars are more fuel efficient and have relatively higher MPG values.
Analysis conclusions
It seems that displacement, horsepower and weight look meaningful, but their shape doesn't look like a straight line. But, does it have to be a straight line? It turns out that linear regression supports also different shapes of the functions!
The shape of the points for the mentioned features resembles a few functions, like the square root function. We'll give it a shot! But what about cylinders and modelyear? They look a bit useful and I can imagine drawing a straight line through them, so classic linear function will do the trick.
The table below shows the conclusions in a more compact way.
| Feature (x) | Looks Useful? | Function Shape |
| passedemissions | No | - |
| cylinders | Somehow yes | Straight line (y = wx + b) |
| displacement | Yes | Square root (y = w√x + zx + b) |
| horsepower | Yes | Square root (y = w√x + zx + b) |
| weight | Yes | Square root (y = w√x + zx + b) |
| acceleration | No | - |
| modelyear | Somehow yes | Straight line (y = wx + b) |
Now is the time for feature engineering in practice - I'm going to achieve a more "slide-ish" shape where it makes sense.
Change function shape
Let's start with displacement. First, I'm going to rerun the model from the previous article for standardized features and displacement as it is.
LinearRegression.r2(trained_model.weights, x_test_std, y_test)
|> Nx.to_number()
|> IO.inspect(label: "Accuracy")

# Result
Accuracy: 0.6336648464202881
Accuracy is ~0.63. And the shape of the prediction line is as expected - totally straight.

Now we'll improve it by adding a new feature - the square root of x.
x_w_sqrt = Nx.concatenate([x, Nx.sqrt(x)], axis: 1)
x_test_w_sqrt = Nx.concatenate([x_test, Nx.sqrt(x_test)], axis: 1)

# Result
#Nx.Tensor<
  f32[314][2]
  EXLA.Backend<host:0, 0.1855147666.821166100.63419>
  [
    [53.0, 7.280109882354736],
    [83.0, 9.110433578491211],
    [60.0, 7.745966911315918],
    [90.0, 9.486832618713379],
    ...
  ]
>
Simple, isn't it? Just remember that from now on, you need to add the new feature to all feature sets - for training, test, and predictions. And for this data set we'll get...
# features - [displacement, sqrt(displacement)]
LinearRegression.r2(trained_model.weights, x_test_w_sqrt_std, y_test)
|> Nx.to_number()
|> IO.inspect(label: "Accuracy")

# Result
Accuracy: 0.7282562255859375
The accuracy went up from ~0.63 to ~0.73 using the very same data and some feature engineering! Nice! And how it will impact the prediction function shape? Let's see...
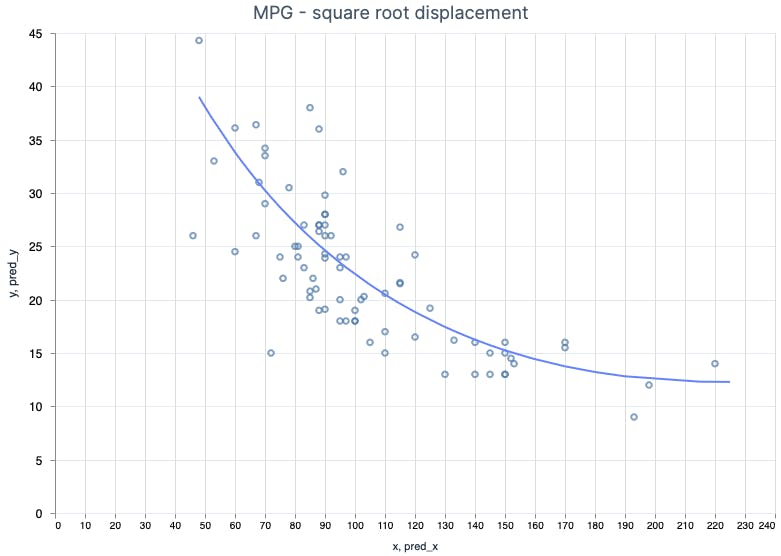
Looks pretty good! I hope you can feel it. To have a better idea of how feature engineering and feature selection impact the accuracy I did a few additional tests with different feature combinations.
| Features | Accuracy | R² (MSE) |
| all | 0.7895334959030151 | 16.324716567993164 |
| all + sqrt() | 0.8667313456535339 | 10.336909294128418 |
all except passedemissions and acceleration | 0.7957956194877625 | 15.838998794555664 |
all + sqrt() except passedemissions and acceleration | 0.8683594465255737 | 10.210624694824219 |
passedemissions | 0.5237807035446167 | 36.937686920166016 |
cylinders | 0.6247956156730652 | 29.10251808166504 |
displacement | 0.6442053318023682 | 27.597017288208008 |
displacement + sqrt() | 0.7580759525299072 | 18.76470375061035 |
horsepower | 0.6671119928359985 | 25.820274353027344 |
horsepower + sqrt() | 0.738216757774353 | 20.305068969726562 |
weight | 0.6993056535720825 | 23.32318878173828 |
weight + sqrt() | 0.7324317097663879 | 20.7537841796875 |
acceleration | 0.2165735960006714 | 60.76603317260742 |
modelyear | 0.3578674793243408 | 49.8066520690918 |
First note: features with square root feature perform better than the original set. acceleration was the most useless feature (accuracy around 0.22, R² equals almost 61!). But performance with and without this feature was pretty much the same. The regression handles such features by setting their weights to be close to zero, so they're insignificant.
The biggest surprise for me here is that passedemmisions did better than modealyear - accuracy of ~0.52 vs 0.36.
Conclusions
Feature engineering is about improving feature set by scaling or creating new ones. Common practice is to apply some functions to a feature like raising to a given power (polynomial regression).
Feature engineering is quite fun because it requires both soft skills like creativity and intuition, and hard mathematical skills, like identifying mathematical function shapes and formulas.

